Statistical Clone: Find Players With Similar Profiles
Choose a player that you like and create a shortlist of players by identifying statistically similar players

Here’s a link to the tool (currently down since Heroku changed its pricing)
In his appearance on the Modern Soccer Coach Podcast, Ted Knutson outlined two ways how he tries to understand what a coach wants from a player personnel perspective. Coaches can either …
Break down what each position is supposed to do in their game model: What is necessary, nice to have, and not that important? This can then be translated into statistical information
Name five players in the last years that have everything that they want a player to do in a certain position
Talking about the second option, he goes on to say that answers often include something like: “Find me the Lionel Messi of Ligue 1." While this request won't bring you an equivalent of Messi, it can serve as a starting point to find a similar player to Messi. Stuttgart's sports director Sven Mislintat took a similar approach when buying Sasa Kalajdzic. Mislintat explained that he was explicitly looking for a player type like Sébastien Haller.
Searching for similar players is a common approach to using statistics to find new players. Sometimes it’s easier to point at some player instead of creating a comprehensive profile from scratch. That's what this tool is for. It gives you a similarity score and allows you to create a shortlist of statistically similar players.
The following post is divided into five sections. The methodology represents the main focus and is therefore sort of lengthy. The motivation for me was to write down my thought process in detail to find gaps and allow others to do the same. Because of that, all comments and feedback — especially suggestions for improvement — are much appreciated.
How to use-Guide
Methodology
Player Roles
Limitations and future improvements
How to use-Guide
Search for a player that you are interested in. Selecting a player will lead to two things. First, the bar chart on the right will be updated. It shows players' percentile ranks in one season against other players in the same position in Europe’s Big 5 Leagues. Second, the data table at the bottom will be updated. Players will be ranked based on their similarity scores.
For the bar chart, you can either use pre-defined templates or customize and select metrics of your preference. The templates are largely copied from Statsbomb. The bar chart will be updated after clicking "Submit".
In Question 3 on the left, you can select another player and compare him to your player from step 1.
The data table can be filtered for three criteria: age, season, and competition. In addition, all numbers can be converted into percentiles and exported as a csv.
There are a few more ways how the data table can be adjusted:
By clicking on "Toggle Columns", you can select only the most insightful metrics for the player that you look for
You can hide columns by clicking on the eye next to a column name. This is possible for every column except the first five.
You can delete players you wouldn't consider by clicking "X" on the far left of the data table
By clicking “Toggle Percentile”, you can convert all metrics into percentiles (ranked in one season against other players in the same position)
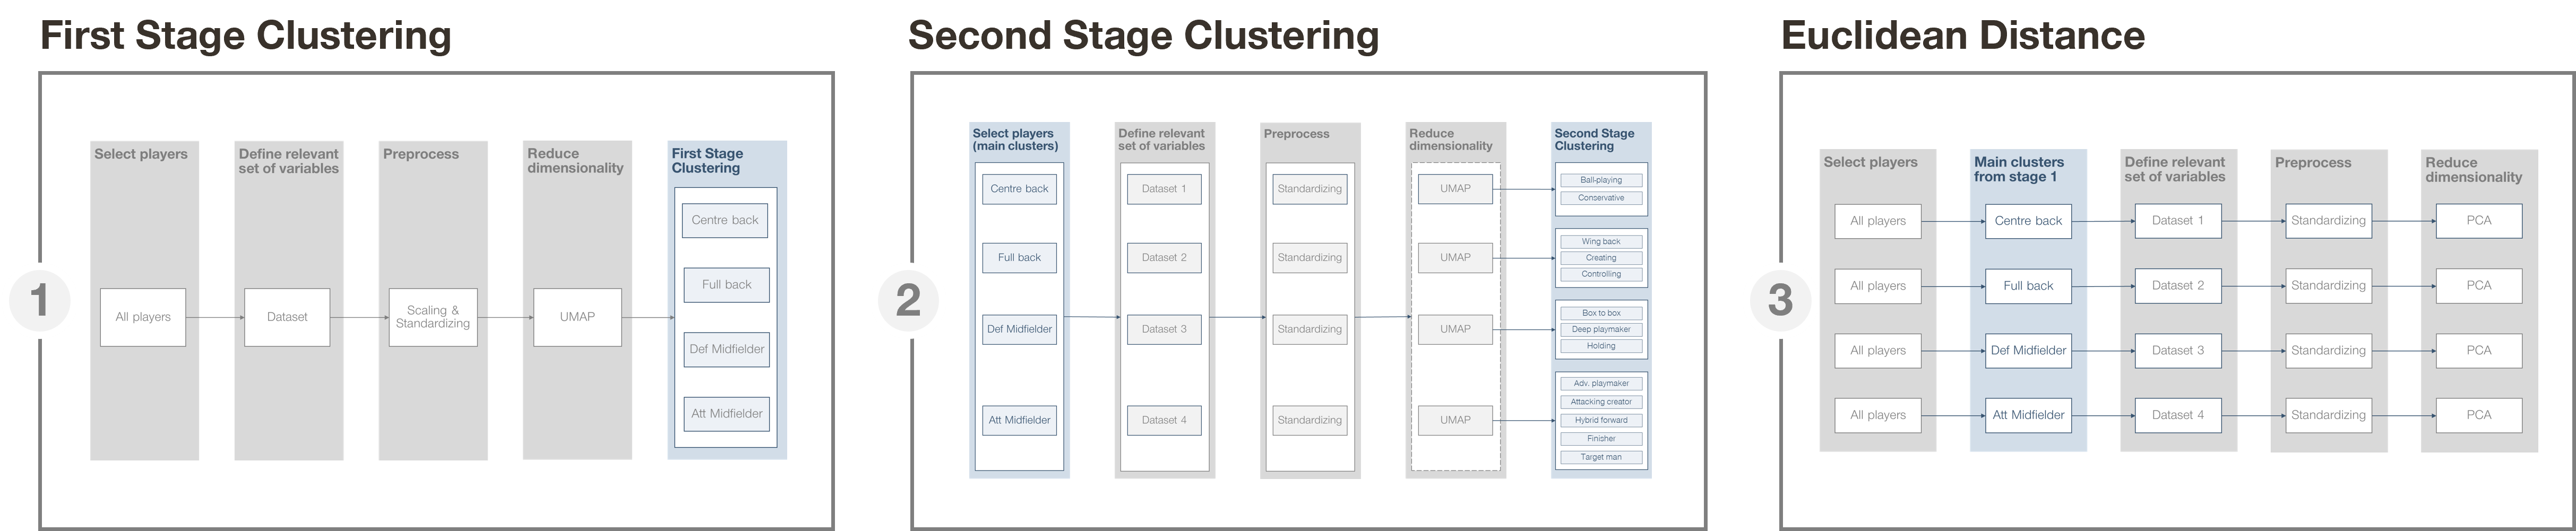
Methodology
As a first step, I created clusters to learn more about a player’s style. I used two rounds of clustering and then calculated the similarity:
1. First Stage Clustering
I used UMAP to reduce the dimensionality. Then I performed a Gaussian Mixture Model (GMM) to create four clusters: centre backs, full backs, defensive midfielders, and attacking midfielders. I refer to these clusters as main clusters.
2. Second Stage Clustering
The main clusters provided the basis for the second round of clustering. The goal was to define sub-clusters within the main clusters. Therefore, I selected relevant metrics for each main cluster and performed a GMM. This resulted in 2-5 sub-clusters per main cluster and 13 sub-clusters in total.
3. Euclidean Distance
After completing the clusters, I used Euclidean distance to calculate the similarity. Instead of UMAP, I used PCA to reduce the dimensionality. More specifically, I performed PCA for each main cluster on each player. Thus, each player ended up with principal components for each main cluster. Example Lewandowski:
A: PCA1A, PCA2A, PCA3A, etc. for his distance to centre backs
B: PCA1B, PCA2B, PCA3B, etc. for his distance to full backs
…
When we search for a similar player to a centre back (e.g., Virgil van Dijk), the first row is used to calculate the similarity. When we search for a similar player to a full back, the second row is used, etc.
Player Roles
Centre backs (main cluster): Ball-playing centre back (sub-cluster)
Ball-playing centre backs tend to play a high number of progressive passes and carry the ball forward. They often combine these attributes with a relatively high number of tackles and interceptions. It’s not uncommon for them to play in higher defensive lines.
Centre backs: Conservative centre back
Conservative centre backs tend to operate from deeper positions. They are regularly involved in defensive headers and register relatively high number of clearances. They don't register many actions in possession.
Full backs: Wing back
Wing backs are oftentimes part of a back 5, performing most of their actions in the attacking third relative to other full-backs. They register high numbers of chance creation through crosses, dribbles, or carries. Their number of progressive passes is often below average as they already receive the ball in more advanced areas.
Full backs: Creating full back
Creating full-backs are usually part of a back 4. They aren't as offensive as wing backs but contribute to the attack and take on an important role in possession. They create chances through their progressive passing, carries, or crosses — either from wide or more central areas.
Full backs: Controlling full backs
Controlling full backs are focused on their defensive duties, trying to keep a compact defensive shape. They perform most of their actions in the defensive third, sometimes as part of a back 3.
Defensive midfielders: Box to box midfielder
Relative to other defensive midfielders, box to box midfielders are primarily involved in actions high up the field. Some of them tend to shoot themselves, amassing high expected goals. Others tend to primarily create for their teammates through carries, passes, dribbles, or crosses.
Defensive midfielders: (Deep) Playmaker
Deep playmakers account for the highest percentage of team touches. They progress the ball less through carries but through their passing. While they usually initiate attacks, they can also directly assist shots. Their profile is complemented by many switches, i.e., passes that travel more than 40 yards of the width of the pitch.
Defensive midfielders: Holding midfielder
Holding midfielders tend to register a high number of interceptions, tackles, and fouls, trying to disrupt the opposition attack. They predominantly perform these actions in the defensive- or mid-third of the pitch. While they progress the ball slightly above average, their passing overall is relatively conservative which leads to a high pass completion rate.
Attacking midfielders: Advanced playmaker
Advanced playmakers have a tendency to start their actions from deeper positions relative to other players in this main cluster. They progress the ball largely through their passing into the final third and the penalty area while registering a decent pass completion rate. Additionally, they also carry the ball into the final third and assist a good number of shots.
Attacking midfielders: Attacking creator
Attacking creators do basically everything offensively with fewer passes than playmakers. They receive the ball in higher positions and carry the ball a lot into the penalty area, dribble, cross, or shoot themselves. Due to their riskier playing style, they also have a higher turnover rate.
Attacking midfielders: Hybrid forward
Hybrid forwards present a mixture of an attacking midfielder and a striker. They can operate as a false nine or from wide areas, then drifting inside. Hybrid forwards don’t stand out for one specific skill but register average numbers in almost all relevant categories.
Attacking midfielders: Target man
The target man usually registers a high number of aerial duels. He is often the target of long balls from the back. His shots are almost exclusively inside the box and often come from crosses. He has decent xG and xA numbers although worse than those of a finisher.
Attacking midfielders: Finisher
The finisher is first and foremost a threat inside the box. He usually has a high shot volume, which often leads to high expected goals numbers. Even though he is primarily a finisher he complements that with above-average expected assists numbers.
Limitations & future improvement
The dataset only includes the Big 5 Leagues, so potential bargains from other, smaller leagues aren’t evaluated. That said, the process and the code could be replicated for other leagues or other data providers like Opta and Wyscout.
The tool largely depends on my assessment of what criteria should be included and the number of clusters. In other words, it’s somewhat subjective and certainly not perfect. Changes here would lead to changes in the cluster assignment and similarity calculation.
One could also factor in the context of a player’s performance and look into the club’s style of play. If a striker like Anthony Modeste is heavily dependent on lots of good crosses, it’s helpful to know that in advance.
Right now, there's no possibility of weighing criteria to calculate the similarity. Incorporating this feature would allow more accurate recommendations based on a club's specific needs. For instance, if Liverpool wants to find a similar player to Firmino, they might be willing to give more weight to someone's pressing ability and his link-up play than goalscoring numbers.
One could enhance this tool by adding players’ market values from Transfermarkt and salaries from Capology. It would help to determine if a player is within a certain budget.
The dataset contains only event data. While this is a good starting point, the addition of spatial data would enable us to draw conclusions about where players perform certain actions.
The reliance on event data makes the evaluation of defenders particularly difficult. Much of what makes a good defender revolves around communication and positioning which cannot be measured with event data.
Additional reading:
John Muller: Comparing attackers
Tony ElHabr: Comparison of PCA + kmeans and UMAP + GMM
Mike Imburgio & Sam Goldberg: Introducing Davies
Mike Imburgio: Defining player roles
Sam Goldberg: Clustering attackers
James McMahon: The Poundshop Messi Machine
Edd Webster: Finding the next Gerard Piqué